I’m want to start using Excel Tables when building my spreadsheets. But first it’s instructive for me to explain how I think about “unofficial” tables or data tables as I like to call them.
How I Think About Tables
A data table is just a range of data, or a region of data that Excel recognizes if you were to use the keyboard shortcut Ctrl+Shift+*.
There are headings in the top row, which I refer to as column headings or data fields. Date, Shift, Machine, and Total Hours are all examples. The Date column has dates in it, and only dates. The Total Hours field has only hours data.
Each row of the data table represents one record. For instance, think about customers. A customer record would contain name, address, city, state, zip, phone number, etc.
My Initial Table Design
The data table I want to design is for a manufacturing facility. We want to record data for each machine by shift. This is common when machine logs are used to collect transactional data throughout the shift. The machine logs are summarized at the end of each shift and it’s this data we want to input into our spreadsheet or data table.
What’s not obvious here is what data fields are collected for input. Suffice to say that the reports have already been designed for key indicators of performance and waste, the calculations traced back to their lowest common denominator or required data field, and that’s what we’re going to collect.
My Table Inputs
I started the data table in row 4 to keep the top area clear for any global input fields and controls for the user. The data fields in the header row were entered and cells formatted: bold, center, word wrap, column widths. I haven’t gone with any background colors in the header row just yet because I’m waiting to see how the Table formatting will turn out.
The header row or data fields are: Date, Shift, Machine, Number Setups, Setup Hours, Run Hours, Down Hours, Total Hours, Net Product, Waste Setup, Waste Run, Gross Product.
I’ve entered the first row of data for a machine on shift one. My next task was to format the data. I used the default Date format for the US, m/d/yyyy, centered the Shift number and Number of Setups. The Hours fields are all formatted to one decimal number. And finally the Product and Waste fields have a number formatting with comma and zero decimal.
One Reason Regular Data Tables Fail
And now the moment where an unofficial Table fails miserably. When the second record gets entered the formatting is not the same. In fact check out the data in the second row. Not good. Not the same. (The Date really bothers me.)
Convert a Data Table to an “Official” Excel Table
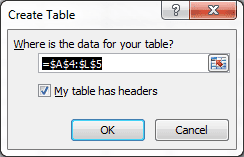
Since I have the formatting set in the first row I’ll delete the second row before converting to a Table. I select a cell inside the table, then choose Insert > Table.

In Excel for Mac choose Tables > New > Insert Table with Headers.

Since Excel has recognized the correct range AND knows that my table has headers, I click OK.
Then as I’ve mentioned before, the first thing I do is remove the filter headings by choosing Data > Filter. Then I reset my column widths and re-enter the second row of data.
Now comes the whole point of this article. An Excel Table remembers the formatting for each data field or column of data.
There are other things that a Table “remembers” as you extend the data, but that will have to wait until next time.


Hi, Gregory.
Excel Tables have great potential and I hope they quickly evolve.
Currently there are frustrating cracks in their abilities. For example with the formatting, Left Indent is NOT remembered, while Right Indent IS.
Another item… If cells have a common formula and you add a new column to the right… the formatting is applied to the new column, but not the formula.
There just seems to be many little annoyances like these and it gets worse with Structured References and Table Styles.
But I am a big fan of the notion of Tables and I hope MS works out the kinks in record time!
Regards,
Daniel Ferry
excelhero.com/blog/
Excel Hero on LinkedIn:
https://www.linkedin.com/groups?gid=3843467
@Daniel thanks for the insight on Tables. Hopefully the benefits will far outweigh the problems, but we’ll see.
Dear Gregory,
I use Excel 2011 for Mac. The Filter icon under Data / Sort & Filter is grayed out and I can therefore not remove the filter headings. Can you please kindly advise?
Thanks.
Louis
If you have an object selected, like a text box or a chart, the Filter box will be grayed out. Make sure a cell in the worksheet is selected, better yet select a cell inside the filtered range. Other than that I don’t know.