To calculate compound annual growth rate (CAGR) in Excel, use =(ending_value/beginning_value)^(1/years)-1, or use RRI with the same three inputs. For revenue that grows from $100,000 in 2021 to $161,051 in 2026, the CAGR is 10%:
=(161051/100000)^(1/5)-1
The easy detail to miss is the 5. There are six year labels from 2021 through 2026, but only five year-to-year intervals. CAGR tells you the steady annual rate that would connect those two revenue values.
Set Up the Revenue Example
Enter these hypothetical annual revenue figures in A1:B7. Keep the years as numbers, and enter revenue as numeric values; you can apply Currency formatting afterward.
| Row | A: Year | B: Revenue |
|---|---|---|
| 1 | Year | Revenue |
| 2 | 2021 | 100000 |
| 3 | 2022 | 112000 |
| 4 | 2023 | 108000 |
| 5 | 2024 | 135000 |
| 6 | 2025 | 150000 |
| 7 | 2026 | 161051 |
Use comparable reporting periods throughout: full-year revenue against full-year revenue, for example. Comparing a full year's revenue with a partial year would give you a misleading growth figure.
You can download the CAGR example workbook to follow the same cells and compare the two formulas.
For this conventional CAGR calculation, the beginning and ending values must be positive, and the elapsed number of years must be greater than zero. A decline between two positive values is fine; it produces a negative CAGR.
Count the Intervals Before Calculating the Rate
Enter Elapsed years in D2 and this formula in E2:
=A7-A2
The result is 5. You can check it by following the gaps: 2021–2022, 2022–2023, 2023–2024, 2024–2025, and 2025–2026.
Don't add 1 to include both years. The first row supplies your starting value; growth happens over the intervals that follow it. Likewise, 2026 to 2030 contains four annual intervals, even though you could list five years.
Subtracting the year numbers works here because the figures cover matching annual periods. If your endpoints are actual dates or partial years, establish the elapsed time in years before using the formula. Don't subtract Excel dates and treat the resulting number of days as years.
Calculate CAGR with RRI
Enter CAGR (RRI) in D3, then enter this formula in E3:
=RRI(E2,B2,B7)
The three arguments follow this order:
| Argument | Cell | What it supplies |
|---|---|---|
nper | E2 | Five elapsed annual periods |
pv | B2 | Beginning revenue of 100000 |
fv | B7 | Ending revenue of 161051 |
The result is 0.1. Select E3 and apply Percentage format to display 10%. Don't multiply the formula by 100 as well; percentage formatting handles the display.
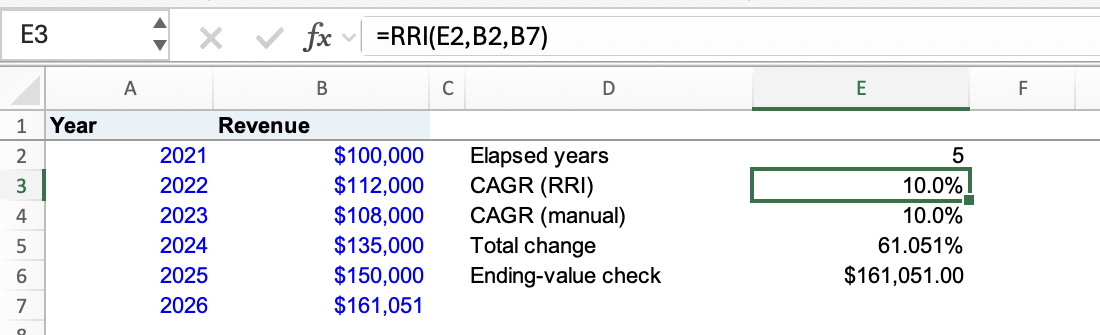
Excel for Mac: E3 uses RRI to return 10.0% across five years; the manual formula gives the same result.
Microsoft's RRI documentation describes the function as calculating an equivalent growth rate from a period count, present value, and future value. All three arguments are required. See the RRI function reference for its syntax and additional examples.
The rate follows the units in your period count. Our five periods are years, so the result is annual. Supplying a count of months would return a monthly rate; RRI doesn't choose the units for you.
Use the Exponent Formula for the Same Result
Enter CAGR (manual) in D4 and this formula in E4:
=(B7/B2)^(1/E2)-1
Format E4 as Percentage. It should also show 10%. Here's how the formula gets there:
B7/B2divides 161051 by 100000, giving 1.61051. This is the growth factor across the entire five-year span.^(1/E2)takes the fifth root, giving 1.1. That is the equivalent growth factor for one year.- Subtracting
1leaves 0.1, or 10%.
Keep the parentheses around 1/E2: the whole fraction belongs in the exponent.
You can check the rate by applying it to the starting revenue for five years. Enter Ending-value check in D6 and this formula in E6:
=B2*(1+E3)^E2
Format E6 as Currency. It should show $161,051.00, matching the final revenue value. This works backward through the same relationship used in a compound interest calculation: a starting value grows by a constant rate over a number of periods.
CAGR Is Different from Total Percentage Change
To see the total change, enter Total change in D5 and this formula in E5:
=B7/B2-1
With Percentage formatting and three decimal places, the result is 61.051%. That describes the whole increase from 2021 to 2026. The percentage change formula is useful when that overall comparison is what your report needs.
Dividing 61.051% by five gives 12.2102%, but that isn't CAGR. It spreads the total percentage increase evenly without accounting for compounding. The fifth-root calculation finds the annual rate that compounds to the ending value.
Check Zero Values, Negative Values, and Errors
If the beginning value is zero, the manual formula divides by zero. There is no ordinary percentage growth rate from a zero baseline. Report the change in amount and explain the baseline instead of forcing a CAGR result.
Negative endpoints, such as a loss becoming a profit, need a different interpretation. They fall outside the positive-value CAGR example here, even if a particular formula happens to return a number. A zero ending value also needs an explicit explanation: for a positive start and positive period count, the manual formula returns −100%, indicating that the ending value is zero. It doesn't describe when the decline occurred.
If RRI returns an error, check that the three input cells contain numbers and that the period count is positive. Microsoft documents #NUM! for invalid argument values and #VALUE! for invalid data types; those general notes aren't a complete list of every invalid numeric combination.
What a 10% CAGR Tells You
In this example, 10% means that multiplying the starting revenue by 1.1 five times reaches the ending revenue. It doesn't mean the business grew at that rate every year. Revenue actually falls from $112,000 to $108,000 between 2022 and 2023 in our sample.
CAGR uses the endpoints and elapsed time, so changing the intermediate revenue figures won't change the result. Keep those annual figures alongside CAGR when readers need to see the ups and downs. The smooth rate summarizes the span; the rows show what happened along the way.