Organizing data into regions or ranges is the first step to harness the power of Microsoft Excel. If your data set is small, using the full power of Excel probably doesn't mean very much. But as your data grows it's important to let Excel do most of the work.
Using features like sorting and filtering, subtotals, data validation, and pivot tables all require that data be organized into what's known as a region, range, or data table. Many people aren't aware of just how powerful Microsoft Excel can be by using these features.
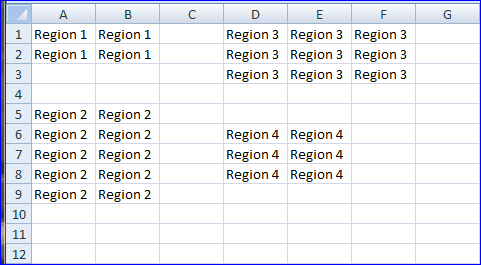
A region is a range of data bounded by blank cells or row or column headings. As you can see below, each of the four regions are bound by blank cells, a column heading, a row heading, or some combination of those three.
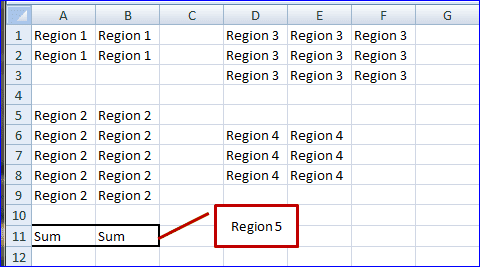
A common way to negate the advantages of having data in a region is to add totals. The region 2 data shown below has summary totals at the bottom, but by leaving row 10 blank and putting totals in row 11 this effectively gives you another region.
 When your data is set is small this presents no problem, but as your data grows it becomes increasingly difficult to use the data rich features of Excel.
So keep in mind that putting data into regions is a key first step when starting a spreadsheet.