This article consists of all the basics of how to make a scatter plot in Excel. By using this guide, you will be able to generate your own plots as well as format them and add design features.
Scatter plots, also known as scatter charts or XY scatter plots, are a powerful visualization tool for your data. They are used by engineers, statisticians, and other scientists to demonstrate visually a relationship between two variables using an XY axis chart.
What is a Scatter Plot?
Before we dive into how to make a scatter plot in Excel, we must first answer the question ‘what is a scatter plot?’ While they may sound complicated to make and use, they are similar to line graphs in many ways, particularly in that they use horizontal and vertical axis to plot out data points. Scatter plots indicate how a variable is affected by another. We call the relationship between the variables the correlation.
Generally speaking, scatter plots contain a wide variety of data. When the two variables are listed close together, this indicates the strength of their relationship. When the variables make a straight line out from the point of origin to high x and y values, they have a positive correlation. The inverse is also true. Variables that go down from a high value on the y-axis to a high value on the x-axis have a negative correlation. A perfect positive correlation has a value of 1. Similarly, a perfect negative correlation has a value of -1.
Relationship Between Variables
A classic example of the relationship between two variables is the one between height and weight. By collecting height and weight data on 100 high school boys, for example, you can then use a scatter plot to demonstrate a relationship between a boy’s height and weight.
The taller the boy, the more likely he’ll weigh a little bit more. Of course, there are some outliers. We all have that really tall, skinny friend, but he will also be taken into account in the scatter plot.
Of course, if you’re looking at this article, chances are you already know a little bit about statistical relationships and scatter plots. What you want to know is how to go about visualizing the data you already have in a neat-looking and comprehensible chart in Excel.
Not all data can be visualized well using a scatter plot, especially if you want a plot that utilizes a great deal of text. You will have to play around with the data you have to figure out whether a scatter plot is appropriate.
Nevertheless, in this article, we will discuss exactly how to make a scatter plot in excel, so you can determine if it shows the information you want to show.
The Data
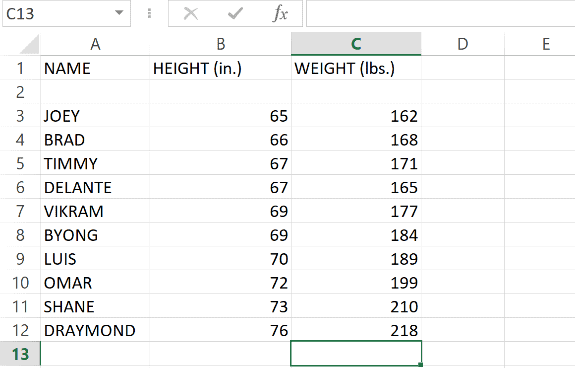
The first thing you will need is to compile your data. For the purposes of this article, we will use the height/weight example to demonstrate how to make a scatter plot in Excel. As you can see from the screenshot, we have three columns: person, height, and weight.
Insert Your Chart
Now that we have the data we need, we will go ahead and insert a chart. To do so, go to the “INSERT” tab and look for the “Charts” menu. There are many different charts you can create using Excel, including a line chart, pie chart, and a column chart.
For now, though, we will stick to the scatter chart, although it is good to know where the other charts are. That way, if a scatter chart doesn’t work for your data, you can easily return to the INSERT tab and try another one.
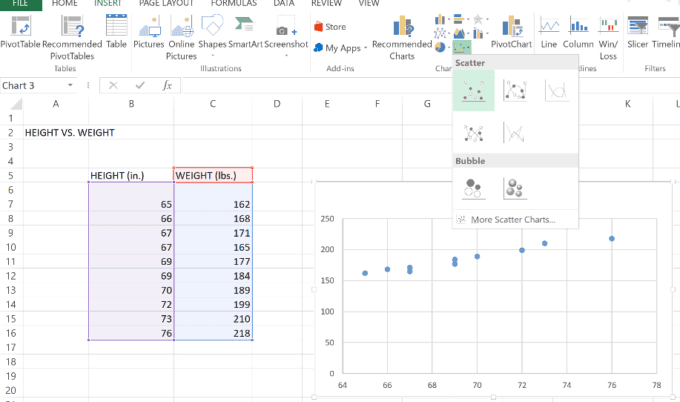
When you click on the scatter chart button, a drop-down menu will appear. The menu presents five different types of scatter chart you can use.
The five different types of scatter chart are:
- 1st Scatter
- 2nd Scatter with smooth lines and markers
- 3rd Scatter with smooth lines
- 4th Scatter with straight lines and markers
- 5th Scatter with straight lines
Each of these charts will present the same relationships, but they will look different. The most recent versions of Excel will show you previews of the charts when you hover the mouse over a specific selection. For example:
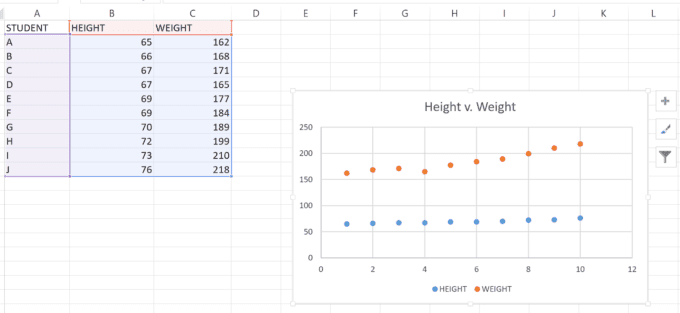
As you can see here, our data has been separated into two lines: the blue for height, and the orange for weight. However, there are a few things we might want to change.
For example, at the moment, the X-axis shows the number of students. This kind of thing is fine, especially if you are showing how a dataset can change over time.
But we want to show a relationship between height and weight instead. To do that we simply select the data differently. Now our chart shows height on the X-axis and weight on the Y-axis.
You can see here in that now we have only blue dots, but they represent the relationship between height, which appears on the X-axis, and height, which appears on the Y-axis.
Adding Design Elements to Your Scatter Plot
Now that you have a scatter plot, you can play around with it. There are many different flourishes that you can add.
One easy thing you could do to this example is to add titles to your axes. As you can see above, none of our axes are named. You have the data right in front of you, so you know what is on the two axes, but other people who are only able to see your scatter plot might not.
By selecting the chart, buttons will appear on the right-hand side, which will allow you to adjust or change design elements. The specific buttons are chart elements, style, and values. To change the axis titles just click the elements button:
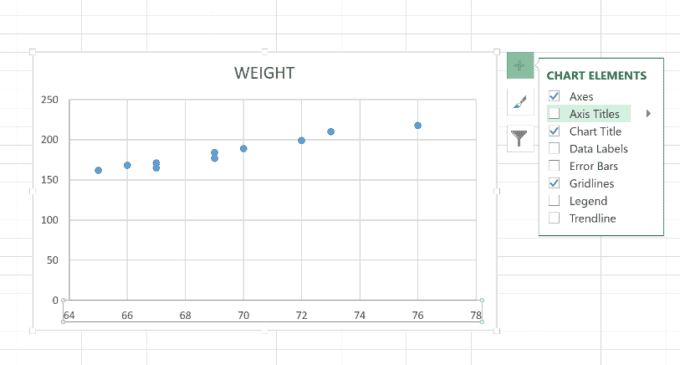
As you can see, there are many different elements you can add to your scatter plot. You can change the title, add a legend, and include a trend line. This will make it easier for your viewers to follow the relationship you are trying to prove.
The Design and Format Tabs
If you click on the “DESIGN” tab you will find even more features. They can help you create the exact design you want. You can change the color of your chart, the scale, whether or not the chart is gridded. You can play around with any design elements you want to see what fits for your specific presentation.
“FORMAT” on the other hand allows you to change things like font style, shape style, and other elements.
How to Make a Scatter Plot in Excel: Final Review
Microsoft Excel has some powerful features that allow its users to present data in many different ways. When you are trying to present relationships between variables, a scatter plot can be a very useful tool. You can choose between numerous kinds of scatter charts to best fit. In addition, once you have chosen and created a chart to present your data. You can then manipulate your plot in any number of ways to better show off that data. You can change myriad design elements to fit the particular needs you or a client has.