Calculating the average of a large or small set of numbers can be a time-consuming task. With Excel, however, this process is simplified, making it easier for you to analyze important data with ease. By using Excel's AVERAGE function, you can quickly calculate the mean of any group of numbers, streamlining your data analysis process.
Most of us are familiar with average values. They offer a great way, to sum up information in a single number. Which gives us an immediate picture of any dataset.
If you have a large data set, Excel can help you find statistical values such as the average.
Not only can this help to enhance your understanding of a dataset, but it can also make information easier to present to supervisors, investors, and even loved ones. Using the AVERAGE function in Excel is easy and takes just a few clicks of the button.
In this tutorial, we’ll show you:
What is an Average Function in Excel?
The average of a group of numbers describes the central value of the set.
The first thing to remember is that using averages can help us to draw generalizations from sets of data.
There are three different ways that are commonly used to measure central tendency:
-
First is the Average: You can calculate the mean of a group of numbers by adding each value together and then dividing by the total count of those numbers. For example, in the group 2,3,5,5,5, the average is (2+3+5+5+5)/5=4. The average of a group of numbers is highly susceptible to outliers.
-
Second is the Median: The median is the number that lies directly in the middle of a set of numbers. For example, in the group 2,3,5,5,5, the median is 5.
-
The third is the Mode: The mode is the number that occurs most frequently in a set of numbers. In the example group of 2,3,5,5,5, the number 5 appears three times, making it the mode.
When Do Averages Come in Handy?
Averages aren’t just a part of your grade school math curriculum.
There are plenty of applications for averages in the real world, both at home and in the office. Notably, you can use averages to draw conclusions about your budget, your grades, your yearly earnings, and even your car’s gas mileage.
With this in mind, there are countless ways that averages can come in handy. However, depending on your situation, you may want to look at different values.
The mean is best used with datasets that contain information that’s evenly spread, such as bell curves.
Extreme outliers in either direction can skew results and lead to false conclusions about central values in a dataset. It is important to realize that when outliers are in play, you should stick to using the median to represent the central value.
The mode works well for smaller sample sets. That is where there’s not enough data to draw relevant conclusions by calculating the mean or median.
The Basics of Excel’s Average Function
The AVERAGE function in Excel returns the mean number for any data set as opposed to the median or mode. In addition, it can be used as a worksheet function, making it easy to enter as part of a formula in a cell.
Your average will depend on the cells that you highlight. For this reason, it may be best to omit any statistically insignificant outliers. A value that’s too high or not high enough can skew your results, giving you an inaccurate picture of your dataset as a result.
Using the Average Function in Excel
Using the AVERAGE function is simple enough for even Excel novices to master in a matter of minutes. As a worksheet function, you only need to enter the formula correctly into a free cell to get a mean value.
The syntax you should use to find the arithmetic mean of a data set is:
AVERAGE (number1,[number2], ...)
You’re required to input very few components into this formula. There’s only one parameter that you really need to fill out in order to yield an accurate result.
-
Number1: This field is required. You can put in a cell value or a range of cells for which you want the average.
-
Number2: This field is optional. If you want to analyze additional cells or ranges, you can add up to 255 more to the AVERAGE formula.
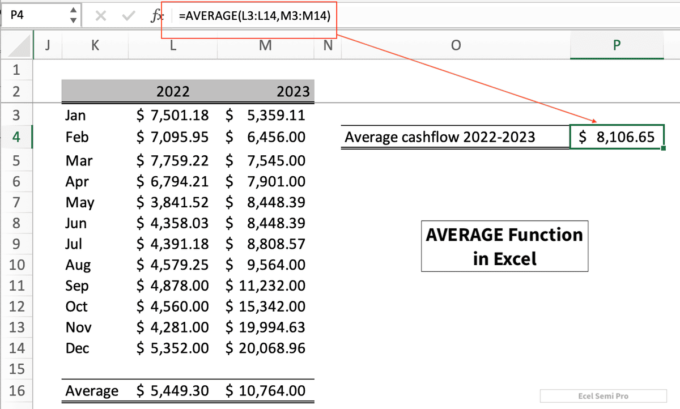
To calculate the average, you can combine two or more ranges together. For example:
=AVERAGE(L3:L14,M3:M14)
If any of the cells in the range you highlighted contain text, or logical values, or are simply empty, the AVERAGE formula will ignore these. Cells that contain a zero, however, are included. If you want to omit any cells within a row or column, you should leave them blank.
If the AVERAGE function isn’t coming up with the results you’re looking for, you may want to consider modifying the formula slightly.
The AVERAGEA and AVERAGEIF Function
The AVERAGEA function allows you to include logical values and text representations of numbers in a reference as part of your end result. This also gives you more control over formatting.
Moreover, you can also combine the AVERAGE function with the IF function to limit the range of values used to calculate a result.
Excel’s IF function allows you to see whether a data point meets a condition that you specify. For example, being greater than another number or occurring within a given timeframe.
The AVERAGEIF function gives you the power to calculate a mean using only values that meet certain criteria.
The Average Function in Action
Here are some examples of common formulas used to find the average of various sets of data:
-
Single column - Average the last few values in a single column:
=AVERAGE(OFFSET(A1,COUNT(A:A),0,-N)) -
Different columns - Average the last few values in different columns:
=AVERAGE(OFFSET(firstcell,0,COUNT(rng)-N,1,N)) -
A range of numbers - Average the last few values in a range of numbers:
{=AVERAGE(LOOKUP(LARGE(IF(ISNUMBER(data),ROW(data)),{1,2,3...}),ROW(data), data))}
Average the top scores in a data set:
=AVERAGE(LARGE(range,{1,2,3...}))
Conclusion
Ultimately, average values are an important part of everyday life. It helps us to quickly and easily understand even large datasets by giving us the central value of a group of numbers. Excel makes it easy to calculate mean values using the AVERAGE function.
Finally, we hope that this tutorial has helped you to better understand how to use the AVERAGE function in Excel.
Indeed the average function in Excel is such a powerful tool when it comes to analyzing data.
Do you need help in freezing columns in Excel? Here is a tutorial on how to do that.