Pivot Charts can help you to take an unorganized set of data and turn it into a clear and concise representation of the information that you’re trying to convey. You can eliminate all unnecessary information and single out key data points in order to better understand specific subcategories of data.
Here, we’re going to look at the most important aspects of Pivot Charts, including:
The Basics of Pivot Charts
Reasons to use Pivot Charts
How to Create a Pivot Chart
What are Pivot Charts?
Pivot Charts offer a visual representation of relevant data from a set. Most often, charts get data points from associated Pivot Tablesinstead of from raw data. Pivot Charts give you more flexibility than tables when it comes to layout and aesthetics, however.
You can display information using categories, markers, axes, and other hallmarks of charts and graphs. Excel’s Pivot Chart tool lets you show off data in just about any format except for an XY (scatter plot), stock graph, or bubble chart.
The Difference Between Pivot Charts and Standard Charts
In most respects, Pivot Charts are similar to standard graphs. They help us to visualize data in a way that’s clear, concise, and easy-to-read using simple shapes and labeled markers.
There are, however, some slight differences when creating Pivot Charts that you should be aware of:
The Orientation of Rows and Columns: With traditional charts, you can easily switch row and column orientation by using the Select Data Source dialog box. With Pivot Charts, however, you can click and drag to “pivot” row and column labels.
Stylistic Limitations: As previously mentioned, you can’t make Pivot Charts in certain standard chart formats, including scatter plots, stock graphs, and bubble charts.
Linked Data Sources: With traditional charts and graphs in Excel, you typically use data directly from worksheet cells. Pivot Charts, however, use information from Pivot Tables to create a simple and user-friendly graph.
Changing Data: You can’t change the chart data range that you use in a Pivot Chart by using the traditional Select Data Source dialog box. Instead, you need to alter the associated Pivot Table.
Editing formatting: When you refresh a Pivot Chart, layout and style stays the same. Elements such as trendlines, data labels, error bars, and other changes to data sets, however, may be lost.
If you usually deal with standard charts in Excel, then Pivot Charts may take some getting used to. As long as you know what you’re doing, though, making a Pivot Chart takes just minutes.
The Benefits of Pivot Charts
Pivot charts are more than just a colorful way to represent important data. There are a number of reasons to make the switch from standard tables to Pivot Charts when presenting data. If you’re trying to glean information from select cells in your data set, using a Pivot Chart is often less time-consuming. It allows you to eliminate any unwanted categories in one swoop instead of forcing you to go through and highlight individual cells. This also reduces the chance of human error messing up your numbers.
When making a Pivot Chart, the information that you use will come from a Pivot Table. If you need to alter any of the data points in your table, you’ll find that your graph updates automatically, making it easy to tinker with numbers and make quick fixes when necessary. This can also help to save you time and frustration over standard charts.
How to Create a Pivot Chart using a Pivot Table
To make a Pivot Chart, it’s easiest first to create a Pivot Table. A Pivot Table helps to summarize data from a large set into a smaller table that contains just the essential information.
You can use data from an Excel worksheet as the basis for a PivotTable, or you can import data sets from external sources such as a software database, an Online Analytical Processing (OLAP) cube, or a text file. You can even base a new Pivot Table on an existing file.
Once you’ve created a Pivot Table either manually or using Excel’s Recommended Pivot Table tool, you can use that information to make a Pivot Chart. While both the table and the chart will contain the same data, they present it in different ways.
Often, graphical representations are easier to read, especially when it comes to spotting patterns.
Creating a Pivot Chart from an Existing Pivot Table is Easy.
In just a few easy steps, you can have a graph that’s ready to go for your next major meeting or presentation. Here’s how to create a Pivot Chart using a Pivot Table:
Select a cell that’s within your Pivot Table range.
Go to PivotTable Tools > Analyze > PivotChart
Select the chart type you want from the options available and click OK.
Format your Pivot Table to your liking using different fonts, colors, and styles.
If you don’t have a Pivot Table at the ready, there’s no need to worry. You can make a Pivot Table and a chart at the same time if you want. Excel’s Recommended Charts tool automatically draws up a Pivot Chart and an associated Pivot Table based on raw data.
You can also do this manually:
Select a cell within your worksheet data.
Go to Insert > Pivot Chart > Pivot Chart.
In the dialog popup box, specify your data source and where you want your chart to be placed. You can also choose whether you want to analyze multiple tables.
Press OK, and Excel will add a new worksheet with a blank Pivot Table and Pivot Chart. Go to the Field List to pick out which fields you want to include in your chart.
Conclusion
Pivot Charts can help you to understand complex data sets and make more informed decisions, both in business and in your personal life. By breaking down data, Pivot Charts allow you to better focus on the information that’s important to your enterprise.
By following the steps laid out in this tutorial, you can create attractive visual representations that are sure to get you noticed at your next presentation.
Microsoft Excel is a powerful spreadsheet software used throughout the world. One of the features within the software is the ability to easily add rows and columns to the spreadsheet. It is a simple feature that is easy to take advantage of and, once you know how to implement it, you'll be able to implement it whenever needed. So if you're a user of the program it is important for you to know how to add a row in Excel.
If you are interested in how to add a row to Excel, you'll want to click on the row heading right below where you want the new row to appear (so if you typed in row 7 and row 9 and discovered you forgot to type in your row 8 information, you'll want to select row 9. This way, when you add the new row it will insert between 7 and 9).
With the row selected, click on the "Insert" button at the top of the Home tab. The new row will now appear above the row you currently have selected.
When you add in a new row, Excel will automatically format the row to look like the rest of the rows you already have. However, when you choose the "Insert" option there will be an "Insert Options" feature that appears on the row (the icon looks like a brush). If you want to change the look or format of the inserted row click on this brush icon, then choose either "Format Same As Left," "Format Same As Right," or "Clear Formatting."
Insert a Column
There might be times where you need to insert a new column of data instead of a new row. The process is similar, but it is important to go over. To begin, you need to select the column heading to the right of where you want the new column to appear (for example, if you want a column to appear between columns C and D, you will click on column D).
Now, select the "Insert" button on the top of the Home tab. The new column will appear.
Deleting a Row
There may be times when using Microsoft Excel where you want to delete a row. The steps for how to delete a row are similar to that of how to add a row in Excel.
Click on the row you want to delete. It is important to click on the header of the row and not the cell. If you click on the cell and choose the "Delete" feature you'll end up removing only the cell which may throw off your calculations and the alignment of the other cells in your spreadsheet.
So click on the number of the row you want to remove. You can click and drag over multiple row headers if you want to remove several rows from your spreadsheet at the same time.
With the row(s) selected, click on the "Delete" button found on the Home tab. This will delete the selected rows and all the rows underneath those removed will move up (so if you deleted row 5 and 6 your former row 7 will now be identified as row 5).
Delete Columns
If you need to remove columns instead of a row, the process is similar. You need to make sure and click on the header of the column. This selects the entire column. You can click and drag over multiple column headers if you want to remove multiple columns at the same time.
Once you have selected the column(s) you want to remove, choose the "Delete" button from the Home tab and the columns will be removed. Once again all the columns to the right will shift over to the left. So if you deleted columns D and E, the former column F will now be identified as column D.
If you renamed the column names, the names you created will remain the same.
When it comes to how to add a row in Excel, you will always want to follow through with a few tips and tricks. Following these tips and tricks will make it easier for you to implement the new row without causing problems with the overall file. The last thing you want to do is cause problems with your files and have to start over completely on a new spreadsheet document.
When looking at how to add a row in Excel, you need to make sure you select the heading of the row and not a cell. If you click on a cell and then choose "Insert," Microsoft Excel will add a new cell and not a new row (or a new column, if you're adding a column). So, if you're running into the problem of only adding a new cell, this is what is going on.
Clearing the Content
There is a difference between deleting an entire row or column and clearing out the content found within the row. You may want to remove all the current information currently found in the cells of a row or column, but if you still need the rows/columns present, you don't want to just delete everything. Instead, you need to follow a "Clear Contents" option.
In order to use the "Clear Contents" option, you will need to click and drag over the rows and columns you wish to clear out. You can either click on the row/column header to select the entire row/column, or you can click and drag over specific cells.
Once you have selected the regions you want to click out, you'll need to right-click within the area you selected (or Control-click if you're using a Mac), then choose "Clear Contents" from the pull-down menu. This will clear out the cells but leave the cells open.
Move a Row/Column
Perhaps you don't need to delete, clear out, or add a row/column. Maybe instead you need to move it. You find information is in the wrong order or you think it would be easier to work if the row is found in a different area of the spreadsheet. You will not need to follow the how to add a row in Excel instructions as these do differ some.
First, you'll want to click on the header of the row you want to move. Once you do this select the "Cut" command found on the Home tab (it is a pair of scissors icon). If you're using a Windows computer, you can use the keyboard shortcut of Ctrl+X (or Command+C if you're using a Mac).
Now, click on the row under where you want the copied row to go. Once you have it selected click on the "Paste" tool found on the Home tab. if you're using a Windows computer, you can use the keyboard shortcut of Ctrl+V (or Command+V on a Mac computer).
Hide/Unhide Row/Column
There might be times where you want to compare two rows together but there are other rows in between that blocks your view. In this case, you will want to hide rows. By hiding rows, you can press two rows together temporarily.
These instructions are similar to how to add a row in Excel. Click on the row header of the rows you want to hide. Chances are there are multiple rows you want to hide so click on all the rows you want to hide for the time being.
Now, right-click on the area you selected and choose "Hide" from the pull-down menu. A green line will remain between the newly created rows. When you want to bring the rows back, you'll want to choose the rows above and below those that are hiding, then right-click in the selected area. Choose "Unhide" from the pull-down menu and the hidden information will appear back onto your screen.
Conclusion
Microsoft Excel is one of those programs you either will never use or you will use on a daily basis. If you are a user of the software, there are a few specifics you must master. One of these features is how to add a row in Excel. When you're able to add and remove rows in Excel, you will be taking the first major step in utilizing the power of the software and how it can make your professional life easier.
Did you know that there are several ways you can learn how to hide columns in Excel? While most people know about this Microsoft software feature, there are a couple of things that you might not be aware of. For example, you can hide or unhide more than one column at a time. If the columns or rows are contiguous, you can also take advantage of the grouping tool within Excel. To save you some time, we have outlined several ways that you can hide and unhide your Excel columns and rows. Read on to learn more.
Columns, rows, and cells are the backbones of Excel spreadsheets. As the main locations where you enter all data, they can hold countless amounts of information. Sometimes though, it’s not necessary to see everything all at once. We will show you a few ways to hide and then unhide columns on your Excel spreadsheet. Remember that everything that follows works for rows too.
Simple Hiding of Columns and Rows
The most common way on how to hide columns in excel is to highlight the column you want to hide and right-click with your mouse.
The pop-up menu will have an option to Hide near the bottom. Simply click it, and your column disappears.
To get the column back, you will need to highlight the columns on either side of the one you hid. For example, if you hid column D, then select columns C and E, right-click and choose Unhide from the bottom of the pop-up.
Column D reappears.
The keyboard shortcuts for the above are just as simple, and we will include the ones in rows too.
Hide Column – Control + 0
Unhide Column – Shift + Control + 0
Hide Row – Control + 9
Unhide Row – Shift + Control + 9
Using Go To
If you have several columns and rows hidden in a spreadsheet but want to be selective about revealing one of those, the Go To command may be your best option.
Assume you have columns C, D, F, H, and K hidden along with rows 3, 5, and 9.
Select Control + G from the keyboard.
The Go To window will pop-up. In the box below Reference, type in one of the destination cells from the column you want to unhide. For our example, type in D11 and click OK.
D11 is now the active cell. You will not see the highlight, but you’ll know you’re there from the cell identification box just to the left of the formula bar.
Select Shift + Control + 0.
Column D should now appear while keeping the other columns and rows hidden.
Group and Ungroup Columns and Rows
So far, we’ve only addressed hiding and unhiding single columns. What if you need to group columns?
Excel has a group feature to help pull together columns (and rows).
First, select the group of columns you want to group and hide. For our example highlight columns B, C, and D.
From there, go to your Data tab and from the Group and Outline box, choose Group. To simplify, your steps should be:
Data > Group & Outline > Group
Once you’ve finished, a line will show up over the B, C, and D columns, indicating that these three columns are grouped.
To collapse this group of columns, click the box to the right of the line. This will hide the three grouped columns.
To unhide, click the box with the plus sign. This is above the column after the last one hidden, in our example column E.
To ungroup the cells, retrace your steps and follow the below:
Data > Group & Outline > Ungroup
Width Adjustment Method
The final way to hide a column or row in Excel is by adjusting the column width using the headings.
In each new spreadsheet, columns start at a fixed width; rows a fixed height. There are two ways to change these.
First, highlight a column and then right click with your mouse. In the pop-up, choose column width and manually enter 0. For rows, you would select row height.
The column is hidden.
You can perform this task with multiple columns or rows. For example, while holding down Control, highlight columns C, D, and F and right-click one of the highlighted cells. Choose column width, type in 0 and click OK.
All three columns are now hidden.
To unhide, simply follow one of the methods outlined above.
The other variation of this technique is to move your mouse between the column or row headings until the cursor changes to a two-sided arrow. From there, hold down with your mouse, and you can slide the width larger or smaller for the column to the left of the cursor.
For rows, you can increase or decrease the height of the row above the cursor.
Troubleshooting
In all instances above, you are only changing the appearance or size of the column (or row) and not the actual values or formulas in a column’s cells. As such, you will run into very few issues when hiding or un-hiding columns.
One thing of note, you can copy a hidden column and paste or insert it elsewhere, even as it remains hidden. This can be confusing if you have a large number of columns or rows hidden in your spreadsheet.
For example, if columns B and D are visible and column C is hidden, if you select B and D to copy and paste, you are also highlighting column C.
When you paste the columns, column C will paste as well, while remaining hidden. This will also work with the cut and insert commands and if columns are grouped.
Finally, always remember that there are different versions of Excel and with each one, a slight variation in the way the information appears or functions. This is also true with Excel on a PC and a Mac.
How to Hide Columns in Excel: Conclusion
The ability to control how you work and view your data within a spreadsheet is one of the key functions in Excel. When the need presents itself to hide columns or rows, the multiple ways to accomplish the task is further proof of Excel’s flexibility.
Whether it’s one column or ten, Excel allows you to choose the best way to present your data.
Have you ever worked in an unorganized spreadsheet? We have to admit, there is nothing more frustrating. When you scrolled down the endless rows, chances are, you couldn’t see your headers anymore. How are you supposed to keep track of where you are plotting data? This is where knowing how to freeze cells in Excel comes in handy.
If you have spent time working in a large worksheet, you may have wondered if there is a way to keep your rows and columns visible. This way, you can keep specific information visible when scrolling down or across. It is time-consuming and cumbersome to navigate back and forth to compare the top of your worksheet to the bottom. Luckily, Excel has a few built-in features to maximize your workflow efficiency.
Sometimes you may want to keep specific information visible while scrolling through your spreadsheet. In this case, Excel’s “Freeze Panes” feature is useful. In this article, we will show you all the ways to freeze the cells and how to do so where rows and columns stay visible. Here are a few tips to keep in mind when learning how to freeze cells in Excel.
Excel can only freeze panes from the top down and left to right.
Panes cannot be frozen while in “Edit” mode.
Frozen Panes can easily be unfrozen.
When and Why You Should Learn How to Freeze Cells in Excel
As mentioned earlier, unnecessary scrolling in Excel is a waste of time. It takes longer than you might think just to scroll up and peek at your category labels. It’s essential to minimize wasted time so you can get your work done efficiently.
In many cases, your spreadsheet will fill up more than what is visible on your screen. Any given worksheet contains a maximum of 1,048,576 rows and 16,384 columns. Thankfully, most spreadsheets will not meet their maximum capacity.
If you are working with several categories, it is helpful to keep your headers on screen at all times. Hence the need to learn how to freeze cells in Excel.
Although it’s not obvious at first glance, learning how to freeze cells in Excel is a simple process. While this feature is quite useful, it does have its limitations and can be a bit finicky at times. Below you will find out how to freeze panes and some common pitfalls to avoid.
Freezing the Top Row
Let’s start with freezing the top row of a worksheet. Freezing the top row is probably the most common use of the “Freeze Panes” feature. Freezing the top row of a spreadsheet allows you to keep your headings in place so that you can see them while scrolling.
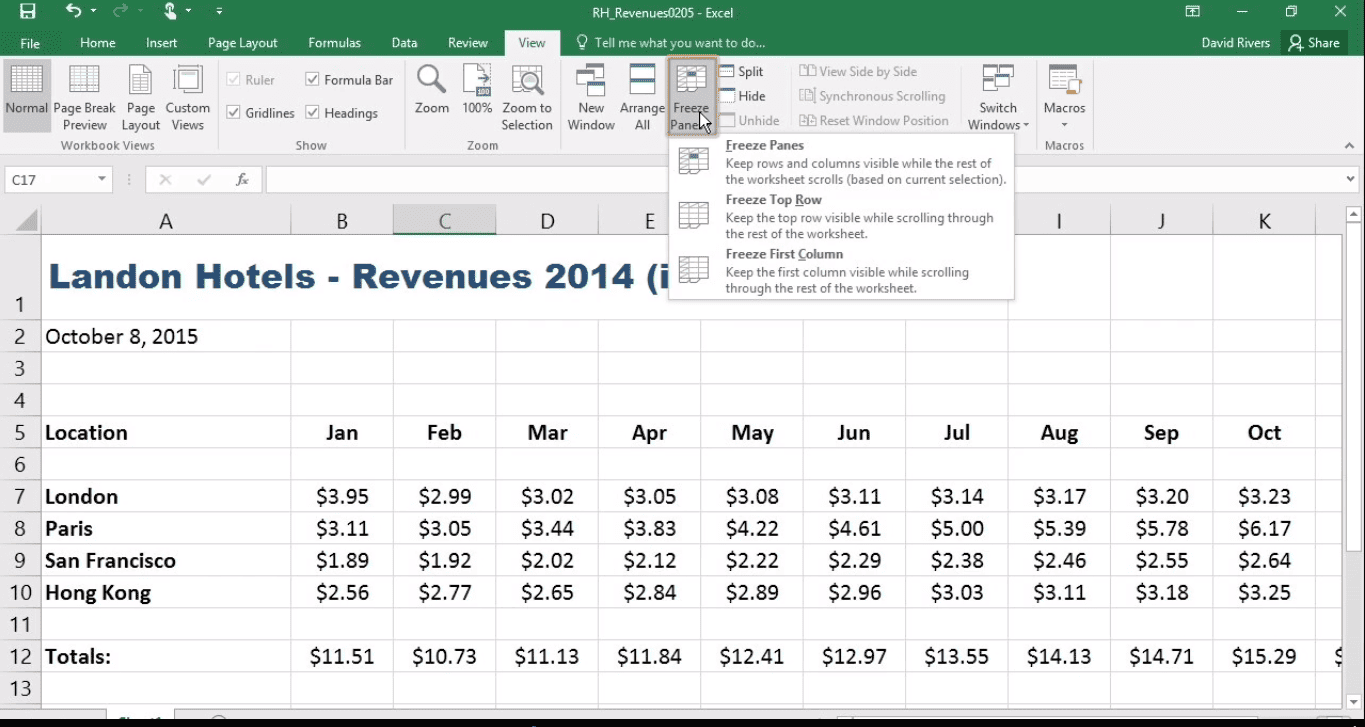
To begin, select the “View” tab on the Ribbon at the top of your page. In this tab, you can check to ensure that your worksheet is in the “Normal” view and also select your desired “Freeze Panes” options. The “Freeze Panes” tool will not be available if your worksheet is not in “Normal” mode.
With your worksheet in “Normal” view, click the drop-down arrow on the “Freeze Panes” icon. You can then select “Freeze Top Row” from here. The top visible row of your worksheet will now be locked in place at the top of your spreadsheet.
Please note that the “Freeze Top Row” option freezes the top visible row of the current spreadsheet. If your worksheet was not scrolled all the way up, you might have frozen your spreadsheet farther down from the actual top. This feature is useful if you want to compare a row in the middle of your spreadsheet to one at the bottom.
If you freeze a “top” row that is not the first row of the worksheet, Excel will hide all rows above the frozen row until you unfreeze your “top” row.
Freezing the Leftmost Column
Let’s say that you’re working in a large worksheet with a list of dates on the leftmost side of the page and multiple categories across the sheet. If you want to keep your dates visible while exploring all of your categories, you will need to freeze the first column of your spreadsheet.
Freezing the first column of your worksheet is precisely like freezing the top row. The only difference is that between the “Freeze Panes” drop-down menu you will select “Freeze First Column.”
Keep in mind Excel defines the “first” column as the leftmost visible column on the screen. If you want that to be your very first column, you must have your worksheet scrolled entirely to the left when selecting this option. Otherwise, you can use this feature to freeze a column from the middle of your spreadsheet to compare it to the right side.
Just like when freezing the “top” row of a worksheet, freezing a column from the middle of the spreadsheet will hide all of the columns to the left until you unfreeze your “first” column.
More Options for How to Freeze Cells in Excel
It is possible to freeze more than one row or column at the same time. Additionally, you can freeze both rows and columns simultaneously. These features can be useful if you need to compare more than one row or column to other rows or columns that are too far separated to see.
To freeze more than one row, select the row below the last row you want to freeze. Navigate to the “Freeze Panes” drop-down menu and select “Freeze Panes.” Excel will freeze all of the rows above your selected row.
Freezing multiple columns is very similar. Highlight the column to the right of the last column you want to freeze. Navigate to and select the “Freeze Panes” option. This freezes all the columns to the left of your selected row.
To freeze rows and columns at the same time, select the cell that is under the last row you want to freeze and to the right of the last column you want to freeze. Navigate to the “Freeze Panes” option and select it by clicking.
To unfreeze rows or columns, select “Unfreeze Panes” from the “Freeze Panes” drop-down menu.
Despite its limited functionality, the “Freeze Panes” feature is handy for working with large worksheets. Knowing how to freeze cells in Excel may take a little practice to master. Have patience while learning the valuable skill and you will reap the benefits of a much more efficient workflow. Excel is a robust program with solutions for nearly every problem you will encounter.
Here’s a Shortcut to Freeze Cells in Excel
Did you know that there are handy keyboard shortcuts for Microsoft Excel programs? Using these shortcuts not only saves you work time but also from pesky, repeated actions. The main reason why people use shortcuts for Excel is that they do not have to take their hands off the keyboard to use a computer mouse and visually search for both menus and buttons. For example, let’s say that you want to add a new workbook. Without using a keyboard shortcut, you would have to click the “office button,” select “new,” and then double click the “blank workbook” icon. Did you know that you can just click Cntrl + N (The control key clicked with the button for n)? The following abbreviations will make your work life a whole lot easier.
Shift + Space: This shortcut will select a row.
Ctrl + C: Use this shortcut to perform the copy action.
Shift + Ctrl + Arrow Down: With this combination, you can select all the way down to the bottom of a region within Excel.
How to Freeze Cells: Final Review
That is it. You see, learning how to freeze cells in Excel is not as daunting as it may have seemed. With these tools and handy shortcuts under your belt, you are well on your way to workplace efficiency.
Learn to how to freeze a row in excel (or even more than 2 rows) using this practical how-to guide.
When you are working with lots of data on your laptop or monitor, it is helpful to know how to freeze a row in Excel. After all, it is often difficult to compare one or more rows with others that you are working on at the bottom of the document. Excel’s freeze pane feature solves this problem. How? You can lock specific rows of data so that they are always visible to you as you scroll through the Excel sheet.
You may or may not know this, but a single Excel worksheet can contain as many as 1,048,576 rows. This program is well known for its ability to create vast databases of information, but how much of that information can you see on your computer screen? The answer, of course, depends upon the size of your computer screen. Even massive screens cannot contain every row of a large spreadsheet. Thankfully, Excel has an available feature allowing users the ability to freeze a row. In this article, we will teach you everything you need to know about how to freeze a row (or multiple rows) in Microsoft Excel.
What Does It Mean to Know How to Freeze A Row in Excel?
Freezing a row within a worksheet will keep that row present at the top of your page while allowing you to scroll through the rest of the spreadsheet. Freezing a row is particularly helpful when you have several data points to consider.
How to Freeze a Row in Excel
Whether you are brand new to Excel or you have some experience, you will find out how to freeze a row in Excel below. Below, we will discuss different scenarios in which freezing a row could be useful and give examples of how to accomplish your desired results.
A few important things to remember when freezing rows in Excel:
Freezing rows is not limited to large spreadsheets
It is easy to unfreeze previously frozen rows
A row must be on screen to freeze it
Keep Your Headers at the Top of Your Worksheet
It is common practice for the top row in a worksheet to be a header row.
The header row contains information about the data found in the cells below each label. When you are working on a large spreadsheet, it is beneficial to keep your headers at the top of your worksheet while you scroll further down into the data.
To keep your headers at the top of your worksheet, you will need to freeze the top row. Keeping your headers at the top of the page will reduce the amount of time you spend scrolling and maximize your workflow.
To freeze the top row of your worksheet, scroll to the top of your spreadsheet. Scrolling to the top of your spreadsheet ensures that your header row is visible on your screen. In the Ribbon at the top of your screen select the “View” tab. In this tab, there are several available options.
To freeze your headers at the top of your worksheet, first ensure that your spreadsheet is in “Normal” view. You can find this setting in the first section of the “View” tab. If your worksheet is in any view other than simply click on “Normal” to select this view.
After you have made sure that your worksheet is in the “Normal” view, you will find the “Window” section in the “View” tab. In the “Window” group you will see a drop-down arrow labeled as “Freeze Panes.” Click the drop-down arrow to open the menu and select “Freeze Top Row.” You should find this as the second option in the drop-down menu.
With all of these steps completed, you will be able to scroll up and down your worksheet without disrupting the position of your header row.
Freezing More Than One Row in Excel
There are times when you might have more than one row at the top of your worksheet that you want to keep visible while scrolling. Excel makes it very simple to freeze more than one row.
To freeze more than one row you will begin by placing your cursor in the row below the lowest row you want to freeze. For example, if you are trying to freeze the first four rows of your worksheet, place your cursor in the fifth row.
After you have placed your cursor appropriately, click on the “View” tab. Once again you will click on the drop-down arrow beside the “Freeze Panes” icon. To freeze multiple rows, you will select “Freeze Panes.” This option should be the first option in the drop-down menu.
When you freeze a row, a dark line will appear underneath the bottom-most frozen row. This line will show you where your frozen rows end, and your non-frozen rows begin. You can now confidently scroll up and down your worksheet while keeping your first few rows in sight.
Unfreezing Rows
When you are finished scrolling through your worksheet’s data, you may want to unfreeze the rows you have previously frozen. Unfreezing rows is just as simple as freezing them. First, select the “View” tab. Next, click the drop-down arrow on the “Freeze Pane” icon. Click “Unfreeze Panes” to return your worksheet to normal.
Freezing Rows Vs. Splitting Panes
Excel offers a second option for keeping specific rows in view while scrolling through the rest of your worksheet. This option is known as the “Split Pane” feature. When you use the “Split Pane” feature of Excel, your screen will split into two or four. You can scroll through each of these panes independently from one another.
In contrast to freezing rows, split panes do not hold a particular set of rows at the top of your worksheet. This flexibility can be useful in some situations, but remember, you cannot freeze a row while splitting panes.
Split panes can be useful in some situations, but they will not always keep your headers in place at the top of your page. To ensure you can view your first rows without scrolling back and forth, choose to freeze rows instead of splitting panes.
Although being able to freeze the first row (or first several rows) is quite handy. It is important to realize that you can only freeze rows from the top down. You cannot freeze rows from the bottom up or freeze a row independently in the middle of the worksheet.
Freezing a Row in Excel: Life Hack
Freezing or unfreezing worksheet sheets commonly includes different mouse clicks, however, I’ll demonstrate to you an approach to complete this assignment with a solitary keystroke. For the uninitiated, solidifying sheets enable you to secure sections or lines that you determine along with the left-hand or potentially top of Excel’s worksheet zone. As you look to one side or down, the solidified segments or lines stay set up so you can generally see worksheet headings or the underlying segments. When you never again need the lines or segments secured, you thus can unfreeze them.
Commercial
To do this errand in Excel 2007 and later, first snap on the worksheet position you wish to solidify. Next, go to the View tab, click on Freeze Panes, and afterward make a determination from the submenu, for example, Freeze Panes.
To open the lines or segments, explore to the View tab, pick Freeze Panes, and afterward Unfreeze Panes. It’s somewhat more straightforward in Excel 2003: pick Window, and afterward Freeze Panes or Window, and afterward Unfreeze Panes, individually.
In any case, you streamline this procedure down to a basic keystroke of your decision in Excel 2007 and later. Select Commands Not in the Ribbon, and after that look down the subsequent rundown until you discover Freeze Sheet Panes. Either double tap on this direction or snap once on it and snap Add to add it to your Quick Access Toolbar. On the off chance that you as often as possible stop and unfreeze sheet sheets, utilize the bolts on the right-hand side to move the Freeze Sheet Panes order with the goal that it’s the main direction on the rundown. Snap OK to close the Excel Options exchange box.
When you’ve put the direction on your Quick Access Toolbar, you would now be able to press the Alt key to uncover the numeric easy route for the Freeze Sheet Panes order. In the event that you made it the primary order on the rundown, you would now be able to squeeze Alt-1 to stop or unfreeze sheet sheets. You should at present position your cursor as before when solidifying sheets, however, you can sidestep exploring through the View tab and the subsequent Freeze Panes submenu.
How to Freeze a Row in Excel: Final Review
Learning how to freeze a row in Excel develops a useful skill to have. Keeping the first row visible while scrolling through your entire worksheet is practical. Frozen header rows can save you time and frustration, especially when dealing with large spreadsheets. Regardless of the size of your worksheet, the process of freezing rows is simple and will make your work easier.If you want to know how to freeze cells in Excel so rows and columns stay visible, we have a tutorial for that here.
One of Excel’s most important features is the ability it gives users to quickly and easily sort through data. With this said, learning how to alphabetize in Excel is critical. If you are not familiar with this skill, don’t worry too much. We will go over alphabetizing lists of strings, ordering numerical values, standard alphabetization, reverse alphabetization, and more. Using Excel we can properly organize data for our businesses or personal finances. Learn how to alphabetize in excel so it is easy to read and refer back to whenever necessary.
What is Excel?
If you are a complete newcomer, you can still walk away from reading this article and learn how to navigate Excel. Let’s start with the basics. Before you learn how to alphabetize in Excel, we need to address the question ‘what is Excel?’ The answer is simple.
Microsoft Excel is a software application included within Microsoft Office Suite. You will use this tool to create spreadsheets (aka documents laid out in rows and columns). Due to the program’s versatility, it has become one of the world’s leading platforms in business since its initial launch in 1985.
What is an Excel Spreadsheet?
The next question you should be asking is ‘what is a spreadsheet?’ In short, spreadsheets organize data into easy ways to read and manipulate (rows and columns). An Excel spreadsheet is composed of columns (vertical boxes labeled ‘A, B, C, D…’ at the top of the screen) and rows (horizontal boxes labeled ‘1, 2, 3, …)’) at the left side of the screen. The intersection of each column and row holds cells where a user can enter either numbers or text. When one refers to the address of a cell, they mean the letter of the cell’s column combined with the row (e.g. A4).
How To Alphabetize In Excel
The main reason people use Excel is to organize data into an easy to read list. You want to be able to refer back to information from years ago, and quickly find something you need.
Excel is so useful because it gives you the ability to do just that. You can organize information alphabetically from A-Z or Z-A. This method allows you to create highly functioning spreadsheets that will keep all your data in order.
We’re going to break down:
How to alphabetize in Excel
Organizing columns that contain multiple strings of information
How to sort spreadsheets that have a combination of letters and numbers
Let’s dive right in!
The Reasons for Alphabetizing
For demonstration purposes, let’s say you are the owner of a sporting goods wholesaler and this is your spreadsheet for the month. If you look at the picture below, there is no structure to the data.
If you had a list built this way for ten years and you needed to look back during an audit. Then it would be incredibly difficult and time-consuming to find the information you need.
If we alphabetize the data, we could:
Scan through to find the name of a customer or product
Choose a specific department to document revenue
Find sales information on a particular product
Keep data organized for accounting and tax purposes
Additionally, if you have employees, having organized spreadsheets is even more critical. If you can’t make sense of your data, your employees will never understand it.
Basic Alphabetization
There are a variety of ways to organize information in Excel. However, we will start with the simplest method and work our way up.
Firstly, highlight the columns or rows you would like to sort by clicking and dragging your mouse across the cells.
Click the Sort & Filter button on the top right of your dashboard, and you will be able to sort Ascending from A-Z, or descending from Z-A.
Accordingly, doing this will organize the columns you have selected alphabetically. As you see above, I arranged the Customer column from A-Z.
One thing to remember:
It’s important to make sure you do not have empty spaces or special characters in front of your data.
Advanced Alphabetization
Alphabetizing in Excel is easy when you are sorting one column. Things get interesting when you have multiple columns, and you need to keep them in order as well.
Let’s say you want to organize alphabetically by the customer. But you also want to keep those customers in groups based on departments they purchase from. You can do that using Excel’s custom sort feature.
Firstly, select all your data by dragging your mouse over everything or clicking the arrow pointing diagonally towards your spreadsheet. Then make sure you highlight the entire spreadsheet – if you are missing cells you won’t have everything sorted.
Next, go back into the Sort & Filter drop-down box and select Custom Sort. Your screen may vary slightly depending on which version of Excel you are using.
In the box above, you will see that there are a few options for sorting your data. Under column, you can choose what header you are sorting. For this example, we will sort by “Product.”
The next option you see is “Sort On” – this is what your cell is based on. For example, we will always leave it as “values.” You can sort based on cell color, font color, and more.
Lastly, you can choose the order for which you are sorting. You can sort ascending from A-Z or descending from Z-A when learning how to alphabetize in Excel.
If we do this, we will have our product list sorted from A to Z similar to the first demonstration, but this time we are going to get more advanced and add another level to the sorting.
In the custom sort dialogue box, click add level, and you will see another row appear.
The second line is labeled “Then by” – this level of sorting will follow whatever is in the first line. Whatever column you include here will sort after your first line of data.
For our example, we will use Revenue as our column to sort after we have alphabetized our products.
We will leave “values” as what we are sorting based on and this time we are dealing with numbers instead of letters – we were given a different option for “order.” We want to sort our revenue from Largest to Smallest to find out what products are our best sellers.
Once you have everything set up and you’re ready to organize your data, press OK, and you now have a spreadsheet that is organized by product first and revenue second.
Looking at this organized spreadsheet, you can quickly identify what your best-selling product in the football department is footballs in packs of 5.
Alphabetizing in a Custom Order
Up until this point, we have been organizing data ascending or descending.
You are probably asking – How do I arrange chronologically by month?
If you organize months alphabetically, February will come first so that would not work. We are going to show you how to get even more technical and organize chronologically.
First, go back to Sort & Filter and open up Custom Sort.
We have added a column for the month now.
Under “order” in the custom sort box, you will choose “custom list,” and it will bring up this dialogue box:
Here you will manually enter the order you want the entries to appear. In this example, we want to order the data – January, February, and March. Click OK to confirm then hit OK again to sort.
Finally, you have a completed list that is organized by Product, Revenue, and Month.
Why Isn’t My Spreadsheet Sorting?
It could be the wrong selection. On the off chance that you chose the off-base lines and sections or not exactly the full cell extend that contains the data you need to sort, Microsoft Excel can’t organize your information the manner in which you need to see it. With a fractional scope of cells chose, just the determination sorts. With void cells chose, nothing occurs. To sort every one of your information without making a choice first, click in one cell inside your information extend. When you open the Sort discourse box, you can see a choice zone encase the information that Excel will arrange.
Effectively Sorted
Issuing a sort direction on an informational collection that you’ve effectively arranged, or that you entered utilizing prearranged information, creates no unmistakable outcomes. Excel reacted to the direction you mentioned, but since you effectively composed your data, you can’t sort similar information twice into a similar request. To re-try your sort and really make a redesigned outcome, you’ll have to adjust your sort parameters.
Off-base or Mixed Data Type
On the off chance that you key in a segment of dates into cells that you’ve set up in a blend of content and date designs, your information won’t sort effectively. By blending your cell groups, you’ve set up a line or segment that contains what could be compared to apples and oranges rather than only either. How you show your information additionally can impact how you translate the aftereffects of a sorting task. Dates that show with just their month and day indicating may sort in a startling request since they really originate from various years. When you see odd outcomes, for example, these, you may need to check your information and cell types.
Additional Considerations
Record or application debasement dependably can create unexpected outcomes even in routine programming activities, for example, a worksheet information sort. On the off chance that checking your information and your worksheet configuration doesn’t resolve your arranging issues, shut down Excel and restart your PC to check whether your outcomes change. You additionally can duplicate your worksheet substance, glue them into another Excel record and attempt your sort task there, viably precluding – or distinguishing – your document as the wellspring of your concern.
What is the Difference Between a Workbook, Worksheet, and a Spreadsheet on Excel?
When you open Microsoft Excel (a spreadsheet program), you’re opening an exercise manual. An exercise manual can contain at least one distinct worksheets that can be gotten to through the tabs at the base of the worksheet your at present survey. Often most confounding that a worksheet is synonymous with a spreadsheet. At the end of the day, a spreadsheet and worksheet mean something very similar. Be that as it may, a great many people just allude to the program like a spreadsheet program and the records it makes as spreadsheet documents.
Spreadsheet Programs
Today, Microsoft Excel is the most prevalent and generally utilized spreadsheet program, however, there are additionally numerous choices. Despite the fact that spreadsheets are regularly utilized with anything containing numbers, the employment of a spreadsheet is practically interminable. The following are some other prominent employments of spreadsheets.
Account
Spreadsheets are perfect for money related information, for example, your financial records data, spending plans, charges, exchanges, charging, solicitations, receipts, conjectures, and any installment framework.
Structures
Structure layouts can be made to deal with stock, assessments, execution audits, tests, time sheets, persistent data, and reviews.
School and Grades
Instructors can utilize spreadsheets to follow understudies, figure reviews, and recognize pertinent information, for example, high and low scores, missing tests, and understudies who are battling.
Records
Dealing with a rundown in a spreadsheet is an extraordinary case of information that does not contain numbers, yet at the same time can be utilized in a spreadsheet. Incredible instances of spreadsheet records incorporate phone, to-do, and basic food item records.
Sports
Spreadsheets can monitor your preferred player details or details in the general group. With the gathered information, you can likewise discover midpoints, high scores, and factual information. Spreadsheets can even be utilized to make competition sections.
What is a Functioning Worksheet?
A functioning worksheet is a worksheet that is as of now open. For instance, in the Excel picture over, the sheet tabs at the base of the window show “Sheet1,” “Sheet2,” and “Sheet3,” with Sheet1 being the dynamic worksheet. The dynamic tab ordinarily has a white foundation behind the tab name.
Why Not Use a Word Processor Instead of a Spreadsheet?
While the facts may prove that a portion of the things referenced above should be possible in a word processor, spreadsheets have a tremendous preferred position over word processors with regards to numbers. It is difficult to compute various numbers in a word processor and have the estimation of the computation quickly show up. Spreadsheets are likewise significantly more unique with the information and can hide, show, and sort data to make handling loads of data simpler.
How to Alphabetize in Excel: Final Review
Finally, Excel is an incredibly useful tool for business owners, entrepreneurs, and those who are financially savvy. This covers everything you will need to know about how to alphabetize in Excel. Follow this article step by step, and you will have no problem finding anything and everything you need to know for years to come! If you want to learn how to make a line graph, hiding columns or freezing rows in excel, then we have them for you too.
When working with Excel spreadsheets, it can be difficult to extract the information you need from large sets of data. Pivot Tables (pv table) offer a great way to quickly condense and analyze, and present your data, allowing you to make informed decisions in both your professional and personal life.
Pivot Tables allow you to effortlessly summarize large amounts of data into a simple format that’s easy to read and analyze. You can subtotal numeric data, sort information into subcategories, or create custom calculations and formulas to focus your results.
Here, we’re going to discuss everything that you need to know about a PV Table, including:
Why you should use Pivot Tables
How to create a Pivot Table
What you can do with Pivot Tables
What are Pivot Tables (AKA Pv Table)?
Pivot Tables, also known as Pv Tables, are an Excel tool that allows you to organize data in a way that’s easy to understand. You can use data from a spreadsheet or import a database table to access the information you need. Excel is able to connect to external sources such as SQL Server tables, Azure Marketplace, Office Data Connection (.odc) files, XML files, Access databases, and text files. Making a Pivot Table won’t alter your original data in any way, but instead will arrange it into a tabular format that makes sense and is easier to read than the original spreadsheet.
The Advantages of Using Pivot Tables
The main function of Pivot Tables is to help you organize large quantities of data in a way that’s quick to analyze. You can filter and sort groups into a table that’s more user-friendly than a raw data set or spreadsheet. Pv Tables also make it easy to expand or collapse rows and columns to narrow down your results, giving you a more detailed picture of important data while cutting out unnecessary background noise.
Not only do Pivot Tables make it easier for you to track data more effectively, but they also make it easier to present information. Whether you’re speaking to family members, co-workers, or supervisors, Pivot Tables give a clear and concise picture of your data that’s easy on the eyes.
If you’re not happy with the layout of your Pivot Table, Excel makes it easy to manipulate and reformat information. Not only can you sort, filter, and group data. But you can also add, rearrange, remove, or change the order of fields. You can also easily change the Pivot Table form, choosing between Compact, Outline, or Tabular.
Tables are in compact form by default, but this may not suit your needs if you want headings for Row fields. If this is the case, you can switch your Pivot Table to Tabular Form, which displays one column per field and provides space for field headers, or Outline Form, which displays subtotals at the top of every group.
Creating Recommended PV Table
Pivot Tables are easy to make with just a few clicks of a button. If you’re new to Excel or Pv Tables in general, you may want to start out using Recommended Pivot Tables. This feature automatically comes up with a layout to match your data set. If you aren’t pleased with the final result, you can always experiment by tweaking rows and columns. To create a Recommended Pivot Table:
Click on any cell in your original data set or table range.
Go to Insert > Tables > Recommended Pivot Table.
Excel analyzes your data and presents you with several options based on the categories it detects in your data.
Select whichever table looks like it will best suit your needs. And then hit OK to create a Pivot Table on a new Excel sheet.
The Recommended Pivot Table feature is a relatively new one, introduced in 2013. It’s only available for users that have the Office 2013 suite or above. If you have an earlier version of the software, you’ll have to create Pv Tables manually.
Manually Creating Pivot Tables
Creating a Pivot Table manually is just slightly more complex than making a Recommended Pivot Table. In addition, it gives you more control over your end results and only takes a few more steps. Here’s how you can manually create a Pivot Table to display your data:
Click on any cell in your original data set or table range.
Go to Insert > Tables > Pivot Table.
A box will pop up displaying the Create Pivot Table dialog. You can select and name a range of Excel cells, or import from an external data source. If you want to analyze multiple tables at once, check the “Add this data to the Data Model” box at the bottom of the popup screen.
On this screen, you can also choose whether you want your report to be opened in a new sheet or an existing worksheet. If you choose to place your table in a current worksheet, you need to select both the file and the cell where you want your Pivot Table to be stored.
Click OK, and you’ll see Excel create a blank Pivot Table and display the Pivot Table Fields list. Here, you’ll select the checkbox for any field you want to add to your Pivot Table.
Using Pivot Tables
Once you’ve finalized the formatting of your PV Table, you can take things one step further. You can turn it into a Pivot Chart.
This gives you an even more powerful way to display data. Especially if you’re planning on using it in a presentation. Pivot Charts add visualizations to data in the form of a graph or other chart type.
This makes it easy to summarize data and spot trends and patterns over time. Pivot Charts automatically update when you adjust your Pivot Table.
Conclusion
Excel is a powerful tool both at home and in the office, but datasets and spreadsheets can get confusing. Pivot Tables help you to make the most of your data. It allows you to eliminate unnecessary information and highlight what’s important to you or your business.
By using Pivot Tables, you can quickly come to conclusions and make informed decisions based on large caches of data. Pivot Tables also make it easy to wow bosses, coworkers, and investors during presentations.
Follow the steps laid out in this article. Spare yourself from a headache by effortlessly organizing and analyzing large data sets using Pivot Tables.
Whether you’re keeping on top of your home life or climbing the corporate ladder. Pivot Tables can come in handy when analyzing and presenting data.
Learn how to hide and unhide columns in Excel using keyboard shortcuts or the Home Menu methods.
Today’s post will illustrate how unhide columns in Excel, as well as hide them.
How to Hide and Unhide Data in an Individual Cell
While Excel does not allow you to Hide and Unhide individual cells using the Hide/Unhide command, here’s a trick showing how to hide just one cell:
Choose the cell or cells you want to hide
Select Cells from the Format menu and the Format Cells dialog box will appear
Select the Number tab
From the list of format categories, select Custom
Enter three semicolons (…) in the Type box
This causes the information in the cell to disappear, and it won’t print. However, you will be able to see the cell information in the Formula Bar. To unhide that individual cell, enter any other type of information.
Hiding Data in Columns and Rows
Hiding data in columns and rows still allows you to reference the data in formulas and charts. Also, hidden formulas that contain cell references will still update if the data in the referenced cells changes.
How to Hide Data in Excel Using Shortcut Keys
First, we’ll discuss how to hide columns and then we will discuss rows.
How to Hide One or More Columns
The shortcut keys for hiding columns is: [Ctrl] + [zero]. Here are the steps:
Choose any cell in the column you want to hide, making it the active cell
Press and hold Ctrl
Press 0 [zero] while holding Ctrl
The entire column with the active cell and any data it contained, will be hidden
Note: Hide multiple columns with this shortcut by highlighting at least one cell in each column you wish to hide, then repeat steps 2 and 3 above.
How to Hide One or More Rows
The shortcut keys for hiding rows is: [Ctrl] + [9]. Here are the steps:
Choose any cell in the row you want to hide, making it the active cell
Press and hold Ctrl
Press [9] while holding Ctrl
The entire row with the active cell and any data it contained is hidden
Note: Hide multiple rows with this shortcut by highlighting at least one cell in each row you wish to hide, then repeat steps 2 and 3 above.
How to Hide Columns or Rows Using the Home Menu
This method has three options on how to unhide columns in excel, depending on the object selected when the menu is accessed.
To Hide a Single Column or Row
Click on the header of the column or row that you would like to hide and the column or row will be highlighted
On the Home tab, in the Cells group, select Format
Under Visibility, select Hide & Unhide, and then Hide Columns (or Hide Rows)
Under Cell Size, click Column Width or Row Height, and then type 0 in the Column Width or Row Height box
The selected column or row and any data is hidden (the header is also be hidden)
To Hide Adjacent Columns or Rows
To hide two or more side-by-side columns or rows:
In the column or row header, click and drag across all of the columns or rows you want to hide
On the Home tab, in the Cells group, select Format
Under Visibility, select Hide & Unhide, and then Hide Columns (or Hide Rows)
Under Cell Size, click Column Width or Row Height, and then type 0 in the Column Width or Row Height box
The selected column or row and any data is hidden (the header is also be hidden)
To Hide Non-Adjacent Columns or Rows
In the column or row header click on the first column or row you want to hide
Press and hold Ctrl while clicking once on each additional column or row you want to hide.
Release Ctrl
On the Home tab, in the Cells group, select Format
Under Visibility, select Hide & Unhide, and then Hide Columns (or Hide Rows)
Under Cell Size, click Column Width or Row Height, and then type 0 in the Column Width or Row Height box
The selected column or row and any data is hidden (the header is also be hidden)
How to Unhide Columns in Excel
To Unhide All Hidden Rows and Columns Simultaneously
Select all of the cells by pressing Ctrl+A or the gray Select All button in the upper left corner of the worksheet.
Note that if your worksheet has data and the active cell is above or to the right of the data, Ctrl+A selects the current region. Press Ctrl+A again to select the entire worksheet.
On the Home tab, in the Cells group, select Format
Do one of the following:
Under Visibility, select Hide & Unhide, and then Unhide Columns (or Unhide Rows)
Under Cell Size, click Column Width or Row Height, then type the value that you want in the Column Width or Row Height box
Under Cell Size, click Column Width or Row Height, and then type 0 in the Column Width or Row Height box
To Unhide the First Row or Column of Your Worksheet
If you’ve hidden the first row or column, take the following steps:
Select the first row or column using one of the following:
In the Name Box next to the formula bar, type A1
On the Home tab, under Editing, click Find & Select > Go To. Type A1 in the Reference box, then click OK.
On the Home tab, in the Cells group, select Format
Under Visibility, select Hide & Unhide, and then Unhide Columns (or Unhide Rows)
Under Cell Size, click Column Width or Row Height, and then type 0 in the Column Width or Row Height box
If you want to learn how to freeze cells in excel so rows and columns stay visible, click here.
This article shows you how to make a drop down list in excel.
It provides two ways for you to quickly and easily make drop down lists in an Excel spreadsheet.
You can follow the instructions to create a new drop down list that will help streamline efficiency when collecting information in your spreadsheet.
A dropdown list can be a useful thing in your spreadsheet. Especially if you want to make it easier for others to enter information on your sheet quickly.
With a dropdown list, you can give other users a quick set of options instead of having to type in each piece of information in every cell.
It is also helpful for the person responsible for the spreadsheet because it standardizes the data you want to collect, which may cut down on confusion or problems when it’s time to inspect your data or make calculations.
This article will go through a step-by-step process of how to make a dropdown list in Excel.
how to enter a list of options that will appear in your dropdown list
and even how to use a dropdown list that you have in a different spreadsheet
Let’s get down to business and learn how to make a drop down list in excel.
How To Make A Drop down List In Excel: Getting Started
Today we are going to use an example of a group of friend’s favorite types of fruit. There are two ways you can do this.
The first involves making one spreadsheet. The other requires you to make two.
For the method involving two separate sheets.
The first spreadsheet, which will be the one where you will eventually insert your dropdown list, will contain the list of all the friends.
The second sheet will be where you create the possible selections of favorite fruits that will make up the dropdown list.
Here is the list of people who will be taking the survey:
And here is the sheet containing the list of fruits that the participants can select:
Now that we have our two spreadsheets set up, we can go about making the list of fruits in Sheet 2 into a dropdown list that users with access to Sheet 1 can select.
Finding the Dropdown Feature
The dropdown feature is not the easiest feature to find in Excel. However, with our help, you’ll be an expert in no time.
In Excel, you must scroll to the “DATA” tab in the menu.
Be sure you are currently on the sheet that you want your dropdown list to appear. In the section named “Data Tools” you will see the feature for “Data Validation” which should look like this:
Once you have found the button, begin by selecting the cell, or in this case the range of cells, you want the list to appear in.
Then click the data validation button.
After that, a dialog box will appear with several options.
Under the “Allow” box, click the dropdown menu and select “List,” which will look like this:
After selecting “List,” you will then tell the spreadsheet what source you want to use, in this case, the list of fruit we made in Sheet 2.
Note that in the “source” line there is now a somewhat complicated looking formula. That’s just telling spreadsheet 1 to look to Sheet 2 to find the items that will be in your dropdown list.
Once you press enter, you will be taken back to spreadsheet 1 with the names of the people taking the survey.
In the column underneath the “FAVORITE FRUIT,” the cells now have a dropdown list. You’ve now made a simple dropdown list for your spreadsheet.
If you want to do all this in a single spreadsheet you will follow some of the same steps for setting up spreadsheet one, but don’t need to make a second sheet.
Instead of pointing your dropdown list to Sheet 2, when you fill out the “source” in the data validation box, you type in the possible options for the dropdown box.
The one-sheet method is useful when you have a limited number of responses, for example, if you are gauging attendance for an event and your only answers are attending/not attending.
But, as in our example, if you have a long list, it’s much easier to make everything on a separate sheet. Using two sheets will also make it easier to modify the list later.
More on Dropdown Lists
Now that you have made your dropdown list, there are a few things that you need to decide on. And you also have a few things to check.
First, if you only want the users to see one spreadsheet, you can hide the other spreadsheet by right-clicking on the tab. And then selecting “hide” from there.
However, if you do it all on one sheet other users could make changes to the dropdown list. Thus, if you are the only one who wants to be able to control what is on the lists. It’s better to follow the two sheet method.
You can also protect the spreadsheet or choose to lock it down so that no other user besides yourself can make changes.
One thing to check on is making sure that the cells are wide enough to display the whole entry.
In our example above, all of the words are relatively short and this isn’t a problem. But it is always a good thing to check before you send your spreadsheet to a bunch of people.
Modifying Your Dropdown List
Maybe you forgot to add your own favorite fruit, or just want more options. Don’t worry. It is quite simple to add items or remove them, from your dropdown list.
If you have made your dropdown list with two spreadsheets, which we feel is the better method, all you have to do is go to that sheet and add the items that you want to be included.
The dropdown list will then automatically be updated in the other spreadsheet.
Similarly, if you want to delete an item you just go to the sheet. From there, you delete whichever items you no longer want to include in your dropdown list. Easy as that!
If you created a dropdown list by manually entering the options, you just have to go into Data Validation again. And then enter the new items to the list from there.
Conclusion
You now know how to make a dropdown list in Excel!
Dropdown lists are useful any time you want users to enter specific data that you have already identified. It can keep things uniform and is more efficient for other users who are entering data.